


Safaricom made KES 50.35 billion in profit after tax in the six months to September 30, 2026, up from KES 29.19 billion a year earlier. That is a 72% jump on total revenue that grew a more modest 14.2% to KES 233.68 billion.
The gap between those two growth rates is the real story, and it comes down to two things: Kenya kept growing steadily, and Ethiopia lost far less money than before.
One quirk is worth clearing up first. The profit that belongs to Safaricom shareholders (KES 58.15 billion, up 35.9%) is bigger than the group’s total profit after tax.
That happens because minority shareholders in the Ethiopia business absorb part of its losses, to the tune of KES 7.8 billion this period. Earnings per share rose from KES 1.07 to KES 1.45.
Kenya Did the Heavy Lifting
Kenya service revenue grew 11.3% to KES 215.96 billion. The Kenya business also grew its EBITDA 13.3% to KES 128.94 billion and its net income 13.8% to KES 66.27 billion.
The company said it held 69.8% of the GSM customer market as of June 2026, while inflation in Kenya crept up to 6.8% in September and the shilling sat near KES 129 to the dollar.
M-PESA is now close to half of the Kenya service revenue. It brought in KES 100.07 billion, up 13.6%, which makes up 46.3% of the total.
The amount of money moving through it rose 16.6% to KES 23.56 trillion. The merchant side grew fastest. The number of merchants jumped 90.3% to 4.51 million, which suggests a lot of small businesses are now taking payments through the platform.
| Line item | HY27 (Billions) | HY26 (Billions) | Change |
|---|---|---|---|
| Service revenue | 226.06 | 199.87 | +13.1% |
| Total revenue | 233.68 | 204.71 | +14.2% |
| Direct costs | 57.55 | 50.79 | +13.3% |
| Other operating expenses | 44.54 | 50.12 | -11.1% |
| EBITDA | 129.18 | 101.29 | +27.5% |
| Depreciation and amortisation | 38.04 | 36.07 | +5.5% |
| EBIT | 91.14 | 65.21 | +39.8% |
| Net finance cost | 9.91 | 9.89 | +0.2% |
| Profit before tax | 81.33 | 55.24 | +47.2% |
| Income tax expense | 30.98 | 26.05 | +18.9% |
| Profit after tax | 50.35 | 29.19 | +72.5% |
| Profit attributable to shareholders | 58.15 | 42.78 | +35.9% |
| Earnings per share (KES) | 1.45 | 1.07 | +35.5% |
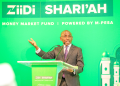
Wealth products are also picking up. Assets under management rose 69.7% to KES 25.56 billion, and the period saw the launch of the ZIIDI Shari’ah Money Market Fund, a Shari’ah-compliant fund available through M-PESA.
READ: Safaricom Launches Ziidi Shari’ah Money Market Fund on M-PESA
The network business grew more slowly. Connectivity revenue rose 7.7% to KES 103.38 billion. Mobile data grew 12.2% to KES 45.24 billion, and voice, still a big earner, grew 6.2% to KES 42.20 billion.
Customers who used chargeable data in the past month rose 11.6% to 27.86 million, which the company links to more smartphones and more 4G+ devices in use.
The smallest piece grew the fastest. Fixed services and IoT revenue climbed 25.5% to KES 12.51 billion, helped by fiber and 5G fixed wireless access. Fixed customers grew 31.8% to 569,860, which is still a small base next to tens of millions of mobile users.
Ethiopia Is Still Losing Money, Just Much Less of It
Safaricom Ethiopia is still deep in the red, but the numbers moved in the right direction. Service revenue grew 71.6% to KES 10.62 billion. Mobile data brought in KES 7.85 billion of that (up 90.2%), which is 74% of Ethiopia’s service revenue.
Customers who were active in the last 90 days rose 38.4% to 15.43 million, and one-month active customers rose 43.4% to 12.20 million.
The loss line is where it gets interesting. Ethiopia’s EBITDA loss shrank by 96.5% to KES 434.4 million.
Working backwards from that percentage, the loss was roughly KES 12.4 billion a year earlier, so Ethiopia improved the group’s EBITDA by around KES 12 billion on its own. That is a big reason the group’s EBITDA grew 27.5% (to KES 129.18 billion) while Kenya’s grew 13.3%.
READ: Safaricom Ethiopia M-PESA Revenue Plunges 64% Despite Customer Growth
| Measure | Kenya (Billions) | Ethiopia (Billions) | Group (Billions) |
|---|---|---|---|
| Service revenue | 216.0 (+11.3%) | 10.6 (+71.6%) | 226.1 (+13.1%) |
| EBITDA | 128.9 (+13.3%) | (0.4) (loss down 96.5%) | 129.2 (+27.5%) |
| EBIT | 101.8 (+13.7%) | (11.4) (loss down 53.4%) | 91.1 (+39.8%) |
| Net income | 66.3 (+13.8%) | (8.8) (loss down 43.2%) | 58.2 (+35.9%) |
| Capex | 35.3 (+3.3%) | 5.0 (-47.2%) | 40.3 |
| Capex as share of revenue | 15.8% (HY26: 17.2%) | 44.9% (HY26: 149.1%) | 17.3% (HY26: 21.3%) |
It is not out of the woods. After depreciation and amortization, Ethiopia’s operating loss was still KES 11.35 billion, though that was 53.4% better than before, and its net loss was KES 8.8 billion, an improvement of 43.2%.
Ethiopia’s inflation reached 14.9% in September and the currency is still under pressure, which the company cites as ongoing headwinds.
The Cost Side Helped Too
Group costs did not rise in step with revenue. Direct costs went up 13.3% to KES 57.55 billion, roughly in line with revenue growth. Other operating expenses actually fell 11.1% to KES 44.54 billion.
Depreciation and amortization rose 5.5% to KES 38.04 billion. Put together, EBIT rose 39.8% to KES 91.14 billion.
Cash, Dividends and Borrowing
Cash generated from operating activities rose to KES 91.92 billion from KES 64.74 billion. Most of that went out the door. Dividends paid came to KES 45.56 billion, up from KES 26.33 billion, and investing activities used KES 56.54 billion.
Borrowing rose to cover part of the gap: other financing activities brought in KES 28.63 billion, against KES 11.14 billion a year earlier.
Current borrowings stand at KES 45.65 billion, up from KES 25.54 billion at the end of March, and total liabilities grew to KES 337.48 billion from KES 287.12 billion. Even so, closing cash was KES 40.54 billion, higher than the KES 30.23 billion a year earlier.
READ: Safaricom Detected 1.25 Billion Cyberattack Attempts in 2026
Spending on the Network
Group capital spending came in at KES 40.3 billion, down from KES 43.7 billion in the first half of last year. Kenya spent KES 35.3 billion, up 3.3%, with 68.9% of that on network equipment.
Ethiopia cut its spending by 47.2% to KES 5.0 billion, with network capex falling 45.1%. As a share of revenue, group capex fell from 21.3% to 17.3%. Ethiopia’s capex was still 44.9% of its revenue, which is high but far below the 149.1% of a year earlier.
| Item | Latest (Billions) | Comparison (Billions) | Change |
|---|---|---|---|
| Net cash from operating activities | 91.92 | 64.74 | +42.0% |
| Net cash used in investing activities | (56.54) | (42.06) | +34.4% |
| Dividends paid | 45.56 | 26.33 | +73.1% |
| Other financing activities (inflow) | 28.63 | 11.14 | +157.0% |
| Closing cash and cash equivalents | 40.54 | 30.23 | +34.1% |
| Current borrowings | 45.65 | 25.54 | +78.7% |
| Total assets | 573.80 | 518.05 | +10.8% |
| Total liabilities | 337.48 | 287.12 | +17.5% |
| Total equity | 236.32 | 230.92 | +2.3% |
Customers and the Rest
Across the group, customers active in the past three months rose 22.3% to 78.99 million, and those active in the past month rose 13.7% to 52.81 million.
On the community side, Safaricom launched the eighth phase of its Ndoto Zetu programme with KES 100 million, bringing the total committed since 2019 to KES 700 million.